世界のスキー場の天気予報

色の凡例 気温 · 風 · 雨 · 雪
各色は表示された値から始まります。風の色は3種類の単位で対応しています。降水のないセルは中立色です。色は表示値を示すもので、公的な気象警報ではありません。
予報グラフを準備中…
時刻と値は詳細予報と一致します。値をタップするかカーソルを合わせると詳細が表示されます。先の日付を見るには各グラフを横にスクロールしてください。雨・降水量は雪を含む各予報時間帯の水換算量です。降雪量は各時間帯の新雪量であり、積雪深ではありません。
GFSとECMWFのモデル比較です。各モデル固有の予報時刻と予報期間を維持しています。降水量と降雪量はそれぞれの予報時間帯の合計であり、時間帯はモデル間で異なる場合があります。
予報値とモデルに関する注記
Beaver Creek - Low lift station
ECMWF · モデル計算時刻: 次回更新予定:
日 時刻(UTC) 気温(°C) 湿度(%) 風速(km/h) 風速(ノット) 風(ビューフォート) 風向 降水量(mm) 降雪量(cm) 気圧(hPa) 0°C高度(m) 天気 | 水曜日, 04/11 06:00 -1.9 72 4 2 1B SE — — 1018 — Partly cloudy 34% cloud  09:00 -1 66 3 1 1B SE 0 0 1017 — Partly cloudy 33% cloud 12:00 -0.6 60 4 2 1B SE 0 0 1014 — Cloudy 69% cloud  15:00 3.1 51 2 1 1B E 0 0 1014 — Cloudy 55% cloud 18:00 9.5 34 3 2 1B NW 0 0 1010 — Clear 16% cloud  21:00 7.9 44 5 3 1B N 0.62 0 1008 — Overcast 88% cloud  木曜日, 05/11 00:00 2.7 71 2 1 1B NE 1.5 0 1012 — Overcast 100% cloud 03:00 2.1 79 2 1 1B N 1.9 0 1015 — Overcast 100% cloud 06:00 1.7 81 2 1 1B NE 0.95 0 1017 — Overcast 98% cloud 09:00 -0.9 79 3 1 1B SE 0.01 0 1019 — Cloudy 72% cloud 12:00 -1.9 77 3 2 1B SE 0 0 1021 — Cloudy 60% cloud 15:00 -0 62 3 2 1B SE 0 0 1023 — Partly cloudy 33% cloud 18:00 7.1 38 1 1 0B W 0 0 1019 — Clear 1% cloud 21:00 9.1 35 2 1 1B W 0 0 1017 — Clear 9% cloud 金曜日, 06/11 00:00 3.6 49 2 1 1B SE 0 0 1018 — Clear 6% cloud 03:00 -0.5 61 5 3 1B SE 0 0 1020 — Partly cloudy 49% cloud 06:00 -0.5 59 4 2 1B SE 0 0 1021 — Overcast 98% cloud 09:00 -0.2 60 4 2 1B SE 0 0 1022 — Overcast 98% cloud 12:00 -0.5 57 3 2 1B SE 0 0 1023 — Overcast 97% cloud 15:00 2.8 47 1 1 1B SE 0 0 1024 — Cloudy 62% cloud 18:00 8.4 37 3 2 1B NW 0 0 1023 — Cloudy 77% cloud 21:00 8.9 38 5 2 1B NW 0 0 1021 — Partly cloudy 49% cloud 土曜日, 07/11 00:00 4.7 53 1 1 1B N 0 0 1022 — Clear 20% cloud 03:00 0.8 63 2 1 1B E 0 0 1024 — Clear 1% cloud 06:00 -0.5 68 1 1 1B SE 0 0 1025 — Clear 3% cloud 09:00 -1.1 70 2 1 1B SE 0 0 1026 — Clear 4% cloud 12:00 -1.9 70 1 1 1B SE 0 0 1027 — Clear 7% cloud 15:00 0.4 63 3 1 1B SE 0 0 1028 — Clear 19% cloud 18:00 8.5 37 3 2 1B NW 0 0 1025 — Clear 0% cloud 21:00 10.1 33 4 2 1B NW 0 0 1023 — Clear 2% cloud 日曜日, 08/11 00:00 4.3 47 0 0 0B SE 0 0 1024 — Partly cloudy 21% cloud 03:00 1 53 2 1 1B E 0 0 1026 — Cloudy 70% cloud 06:00 1.1 46 2 1 1B SE 0 0 1026 — Cloudy 67% cloud 09:00 0.1 46 2 1 1B SE 0 0 1026 — Clear 0% cloud 12:00 -0.3 43 3 2 1B SE 0 0 1025 — Clear 4% cloud 15:00 3.8 34 2 1 1B SE 0 0 1026 — Clear 4% cloud 18:00 11.4 21 4 2 1B W 0 0 1024 — Clear 0% cloud 21:00 12.3 21 4 2 1B W 0 0 1022 — Clear 0% cloud 月曜日, 09/11 00:00 5.6 36 1 1 1B SE 0 0 1023 — Clear 0% cloud 03:00 2.4 39 2 1 1B SE 0 0 1024 — Clear 0% cloud 06:00 2 36 1 1 1B SE 0 0 1024 — Clear 0% cloud 09:00 1.3 37 1 1 1B SE 0 0 1024 — Clear 0% cloud 12:00 0.6 38 1 1 1B SE 0 0 1024 — Clear 0% cloud 15:00 4.2 32 2 1 1B SE 0 0 1024 — Clear 0% cloud 18:00 11.9 22 3 2 1B W 0 0 1022 — Clear 0% cloud 21:00 12.9 23 4 2 1B NW 0 0 1020 — Clear 0% cloud 火曜日, 10/11 00:00 6.7 39 0 0 0B NE 0 0 1021 — Clear 0% cloud 03:00 3.3 48 2 1 1B E 0 0 1022 — Clear 3% cloud 06:00 2.3 49 2 1 1B SE 0 0 1023 — Clear 0% cloud |
|---|
Forecast notes
Forecast table times: UTC.
Coordinates: 39.6325715°N, -106.5626876°E · Requested elevation: 2259 m. Model terrain: 2955 m. Terrain and 1000/925/850/700 hPa profiles are used for height estimates.
Outside the available profile, temperature uses an estimated 5.5°C/km height correction; wind retains the nearest available model-level value. Humidity is estimated with adjusted pressure and temperature.
These are altitude estimates, not a simulation of local mountain terrain. Precipitation, cloud and sea-level pressure use horizontal interpolation only.
Precipitation includes rain and snow water equivalent: preceding 3 hours through day 6, then 6 hours (see cell tooltip). Snow (cm) estimates fresh snowfall from precipitation and temperature using the GFS conversion; it is not snow depth on the ground. Freezing (m) uses additional 600/500 hPa temperatures when available and estimates the lowest resolved 0°C crossing above sea level. When all sampled levels are warm, the upper profile limit is shown (see tooltip). < marks an entirely cold sampled profile and its lower height limit. No extrapolation is used.
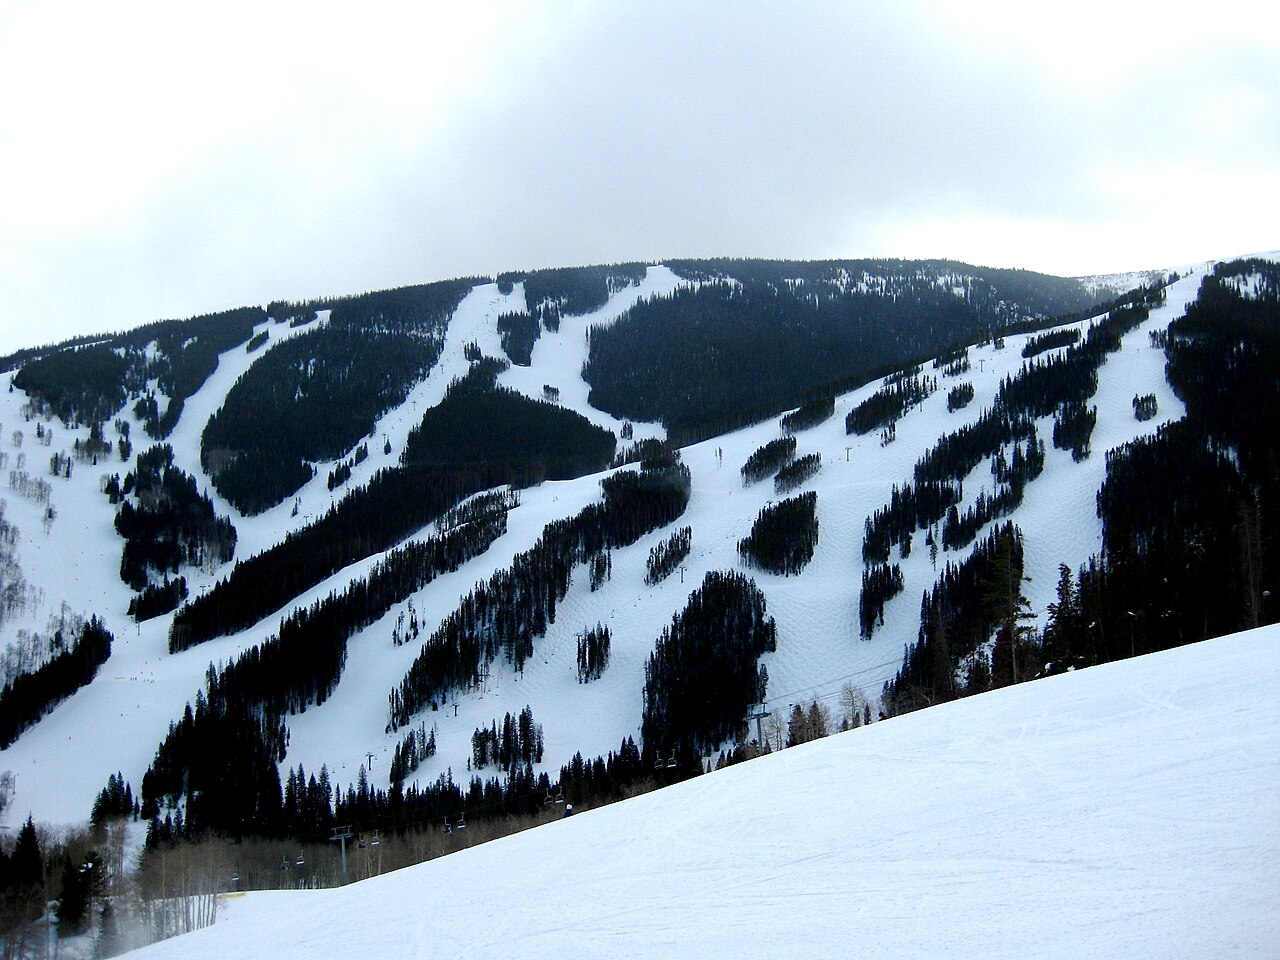
Beaver Creek is a downhill ski area in Colorado, United States. Mapped terrain includes easy, intermediate, advanced, expert routes. Its mapped lift network extends from approximately 2259 to 3484 metres above sea level.
Data: OpenSkiData / OpenSkiMap, OpenStreetMap contributors (ODbL), Skimap.org, Who's On First, Mapterhorn.
予報グラフを準備中…
時刻と値は詳細予報と一致します。値をタップするかカーソルを合わせると詳細が表示されます。先の日付を見るには各グラフを横にスクロールしてください。雨・降水量は雪を含む各予報時間帯の水換算量です。降雪量は各時間帯の新雪量であり、積雪深ではありません。
GFSとECMWFのモデル比較です。各モデル固有の予報時刻と予報期間を維持しています。降水量と降雪量はそれぞれの予報時間帯の合計であり、時間帯はモデル間で異なる場合があります。
予報値とモデルに関する注記
Beaver Creek - Base lift station
ECMWF · モデル計算時刻: 次回更新予定:
日 時刻(UTC) 気温(°C) 湿度(%) 風速(km/h) 風速(ノット) 風(ビューフォート) 風向 降水量(mm) 降雪量(cm) 気圧(hPa) 0°C高度(m) 天気 | 水曜日, 04/11 06:00 -3.6 73 5 3 1B SE — — 1018 — Partly cloudy 47% cloud 09:00 -2.7 68 3 2 1B SE 0 0 1017 — Partly cloudy 33% cloud 12:00 -2.1 61 5 3 1B SE 0 0 1014 — Cloudy 69% cloud 15:00 1.8 52 3 2 1B SE 0 0 1013 — Cloudy 52% cloud 18:00 8.6 33 3 1 1B NW 0 0 1009 — Clear 19% cloud 21:00 6.1 49 6 3 2B N 0.81 0 1009 — Overcast 90% cloud 木曜日, 05/11 00:00 1.2 74 2 1 1B E 1.8 0 1012 — Overcast 100% cloud 03:00 0.9 81 2 1 1B N 2.0 0.6 1015 — Overcast 100% cloud 06:00 0.5 83 2 1 1B NE 0.91 0.3 1017 — Overcast 98% cloud 09:00 -2.5 80 3 2 1B SE 0.00 0 1019 — Cloudy 72% cloud 12:00 -3.6 79 4 2 1B SE 0 0 1021 — Cloudy 62% cloud 15:00 -1.6 64 4 2 1B SE 0 0 1022 — Partly cloudy 37% cloud 18:00 6.3 38 1 0 0B SW 0 0 1019 — Clear 1% cloud 21:00 8 35 2 1 1B SW 0 0 1017 — Clear 9% cloud 金曜日, 06/11 00:00 2 50 2 1 1B SE 0 0 1019 — Clear 5% cloud 03:00 -2 62 6 3 1B SE 0 0 1020 — Partly cloudy 49% cloud 06:00 -2.2 62 5 3 1B SE 0 0 1022 — Overcast 98% cloud 09:00 -1.9 63 5 3 1B SE 0 0 1022 — Overcast 98% cloud 12:00 -2.4 61 4 2 1B SE 0 0 1023 — Overcast 97% cloud 15:00 1.1 50 2 1 1B SE 0 0 1024 — Cloudy 66% cloud 18:00 7.3 38 3 2 1B NW 0 0 1023 — Overcast 81% cloud 21:00 7.3 40 5 3 1B NW 0 0 1021 — Cloudy 59% cloud 土曜日, 07/11 00:00 3.2 56 1 1 1B N 0 0 1023 — Partly cloudy 22% cloud 03:00 -0.9 66 2 1 1B SE 0 0 1024 — Clear 1% cloud 06:00 -2.2 70 1 1 1B SE 0 0 1025 — Clear 2% cloud 09:00 -3 73 2 1 1B SE 0 0 1026 — Clear 4% cloud 12:00 -4 74 2 1 1B SE 0 0 1027 — Clear 10% cloud 15:00 -2 67 3 2 1B SE 0 0 1028 — Partly cloudy 30% cloud 18:00 7.3 37 3 2 1B NW 0 0 1025 — Clear 0% cloud 21:00 8.8 34 4 2 1B NW 0 0 1023 — Clear 2% cloud 日曜日, 08/11 00:00 2.6 49 0 0 0B S 0 0 1024 — Clear 19% cloud 03:00 -0.6 55 2 1 1B SE 0 0 1026 — Cloudy 71% cloud 06:00 -0.7 48 2 1 1B SE 0 0 1026 — Cloudy 68% cloud 09:00 -1.9 49 3 2 1B SE 0 0 1026 — Clear 0% cloud 12:00 -2.4 47 4 2 1B SE 0 0 1025 — Clear 7% cloud 15:00 2.2 34 3 2 1B S 0 0 1026 — Clear 7% cloud 18:00 10.5 21 4 2 1B W 0 0 1024 — Clear 0% cloud 21:00 10.9 22 4 2 1B W 0 0 1022 — Clear 0% cloud 月曜日, 09/11 00:00 4.1 38 1 1 1B SE 0 0 1023 — Clear 0% cloud 03:00 0.7 40 2 1 1B SE 0 0 1024 — Clear 0% cloud 06:00 0.3 37 1 1 1B SE 0 0 1024 — Clear 0% cloud 09:00 -0.5 39 2 1 1B SE 0 0 1024 — Clear 0% cloud 12:00 -1.3 41 2 1 1B SE 0 0 1024 — Clear 0% cloud 15:00 2.5 34 2 1 1B SE 0 0 1024 — Clear 0% cloud 18:00 10.9 22 3 2 1B W 0 0 1022 — Clear 0% cloud 21:00 11.6 23 4 2 1B NW 0 0 1020 — Clear 0% cloud 火曜日, 10/11 00:00 5.1 41 0 0 0B E 0 0 1021 — Clear 0% cloud 03:00 1.8 50 2 1 1B E 0 0 1023 — Clear 3% cloud 06:00 0.8 51 2 1 1B SE 0 0 1023 — Clear 0% cloud |
|---|
Forecast notes
Forecast table times: UTC.
Coordinates: 39.6040676°N, -106.5154022°E · Requested elevation: 2473 m. Model terrain: 3052 m. Terrain and 1000/925/850/700 hPa profiles are used for height estimates.
Outside the available profile, temperature uses an estimated 5.5°C/km height correction; wind retains the nearest available model-level value. Humidity is estimated with adjusted pressure and temperature.
These are altitude estimates, not a simulation of local mountain terrain. Precipitation, cloud and sea-level pressure use horizontal interpolation only.
Precipitation includes rain and snow water equivalent: preceding 3 hours through day 6, then 6 hours (see cell tooltip). Snow (cm) estimates fresh snowfall from precipitation and temperature using the GFS conversion; it is not snow depth on the ground. Freezing (m) uses additional 600/500 hPa temperatures when available and estimates the lowest resolved 0°C crossing above sea level. When all sampled levels are warm, the upper profile limit is shown (see tooltip). < marks an entirely cold sampled profile and its lower height limit. No extrapolation is used.
予報グラフを準備中…
時刻と値は詳細予報と一致します。値をタップするかカーソルを合わせると詳細が表示されます。先の日付を見るには各グラフを横にスクロールしてください。雨・降水量は雪を含む各予報時間帯の水換算量です。降雪量は各時間帯の新雪量であり、積雪深ではありません。
GFSとECMWFのモデル比較です。各モデル固有の予報時刻と予報期間を維持しています。降水量と降雪量はそれぞれの予報時間帯の合計であり、時間帯はモデル間で異なる場合があります。
予報値とモデルに関する注記
Beaver Creek - Top lift station
ECMWF · モデル計算時刻: 次回更新予定:
日 時刻(UTC) 気温(°C) 湿度(%) 風速(km/h) 風速(ノット) 風(ビューフォート) 風向 降水量(mm) 降雪量(cm) 気圧(hPa) 0°C高度(m) 天気 | 水曜日, 04/11 06:00 -9.8 97 5 3 1B SE — — 1018 — Cloudy 60% cloud 09:00 -8.9 91 4 2 1B S 0 0 1017 — Partly cloudy 35% cloud 12:00 -8 80 5 3 1B SE 0 0 1014 — Cloudy 66% cloud 15:00 -4.1 68 3 2 1B SE 0 0 1013 — Partly cloudy 48% cloud 18:00 3 41 2 1 1B NW 0 0 1009 — Partly cloudy 22% cloud 21:00 0 67 6 3 2B N 0.91 0.3 1009 — Overcast 90% cloud 木曜日, 05/11 00:00 -4.6 98 1 1 1B E 1.9 1.9 1012 — Overcast 100% cloud 03:00 -4.7 100 2 1 1B N 1.9 1.9 1015 — Overcast 100% cloud 06:00 -5.1 100 2 1 1B NE 0.89 0.9 1017 — Overcast 97% cloud 09:00 -8.3 100 3 2 1B SE 0.00 0 1019 — Overcast 81% cloud 12:00 -9.5 100 4 2 1B S 0 0 1021 — Cloudy 73% cloud 15:00 -7.7 88 5 3 1B SE 0 0 1022 — Partly cloudy 44% cloud 18:00 0.8 48 1 0 0B S 0 0 1019 — Clear 1% cloud 21:00 2.4 43 2 1 1B S 0 0 1016 — Clear 9% cloud 金曜日, 06/11 00:00 -3.8 65 3 2 1B SE 0 0 1019 — Clear 4% cloud 03:00 -7.7 81 6 3 2B SE 0 0 1020 — Partly cloudy 47% cloud 06:00 -8.2 84 6 3 2B SE 0 0 1022 — Overcast 98% cloud 09:00 -7.8 86 6 3 2B S 0 0 1022 — Overcast 98% cloud 12:00 -8.6 82 5 2 1B S 0 0 1023 — Overcast 98% cloud 15:00 -5 68 2 1 1B S 0 0 1024 — Cloudy 66% cloud 18:00 1.6 50 4 2 1B NW 0 0 1023 — Overcast 85% cloud 21:00 1.5 54 6 3 1B NW 0 0 1021 — Cloudy 70% cloud 土曜日, 07/11 00:00 -2.4 74 1 1 1B NW 0 0 1023 — Partly cloudy 24% cloud 03:00 -6.7 86 1 1 1B SE 0 0 1024 — Clear 0% cloud 06:00 -8.1 94 2 1 1B S 0 0 1025 — Clear 2% cloud 09:00 -9 98 2 1 1B S 0 0 1026 — Clear 3% cloud 12:00 -10.4 100 2 1 1B S 0 0 1027 — Clear 11% cloud 15:00 -8.8 92 4 2 1B S 0 0 1028 — Partly cloudy 39% cloud 18:00 1.7 46 3 2 1B NW 0 0 1025 — Clear 0% cloud 21:00 3.1 42 4 2 1B NW 0 0 1023 — Clear 2% cloud 日曜日, 08/11 00:00 -3.2 63 0 0 0B S 0 0 1025 — Clear 15% cloud 03:00 -6.3 71 2 1 1B SE 0 0 1026 — Cloudy 73% cloud 06:00 -6.7 64 2 1 1B S 0 0 1026 — Cloudy 65% cloud 09:00 -8.2 66 4 2 1B S 0 0 1026 — Clear 0% cloud 12:00 -8.7 64 5 3 1B S 0 0 1025 — Clear 9% cloud 15:00 -3.8 45 4 2 1B S 0 0 1026 — Clear 9% cloud 18:00 5 26 4 2 1B NW 0 0 1024 — Clear 0% cloud 21:00 5.3 29 4 2 1B W 0 0 1022 — Clear 0% cloud 月曜日, 09/11 00:00 -1.5 50 1 1 0B SE 0 0 1024 — Clear 0% cloud 03:00 -5.2 55 2 1 1B S 0 0 1024 — Clear 0% cloud 06:00 -5.8 51 2 1 1B S 0 0 1024 — Clear 0% cloud 09:00 -6.6 53 2 1 1B S 0 0 1024 — Clear 0% cloud 12:00 -7.6 56 2 1 1B S 0 0 1024 — Clear 0% cloud 15:00 -3.7 46 2 1 1B S 0 0 1024 — Clear 0% cloud 18:00 5.4 29 3 2 1B NW 0 0 1022 — Clear 0% cloud 21:00 5.9 30 4 2 1B NW 0 0 1020 — Clear 0% cloud 火曜日, 10/11 00:00 -0.7 53 0 0 0B S 0 0 1022 — Clear 0% cloud 03:00 -3.9 64 1 1 1B SE 0 0 1023 — Clear 2% cloud 06:00 -5.2 68 3 1 1B S 0 0 1023 — Clear 0% cloud |
|---|
Forecast notes
Forecast table times: UTC.
Coordinates: 39.5662675°N, -106.5084681°E · Requested elevation: 3484 m. Model terrain: 3114 m. Terrain and 1000/925/850/700 hPa profiles are used for height estimates.
Outside the available profile, temperature uses an estimated 5.5°C/km height correction; wind retains the nearest available model-level value. Humidity is estimated with adjusted pressure and temperature.
These are altitude estimates, not a simulation of local mountain terrain. Precipitation, cloud and sea-level pressure use horizontal interpolation only.
Precipitation includes rain and snow water equivalent: preceding 3 hours through day 6, then 6 hours (see cell tooltip). Snow (cm) estimates fresh snowfall from precipitation and temperature using the GFS conversion; it is not snow depth on the ground. Freezing (m) uses additional 600/500 hPa temperatures when available and estimates the lowest resolved 0°C crossing above sea level. When all sampled levels are warm, the upper profile limit is shown (see tooltip). < marks an entirely cold sampled profile and its lower height limit. No extrapolation is used.